Price Intelligence
NYYU Price Overview
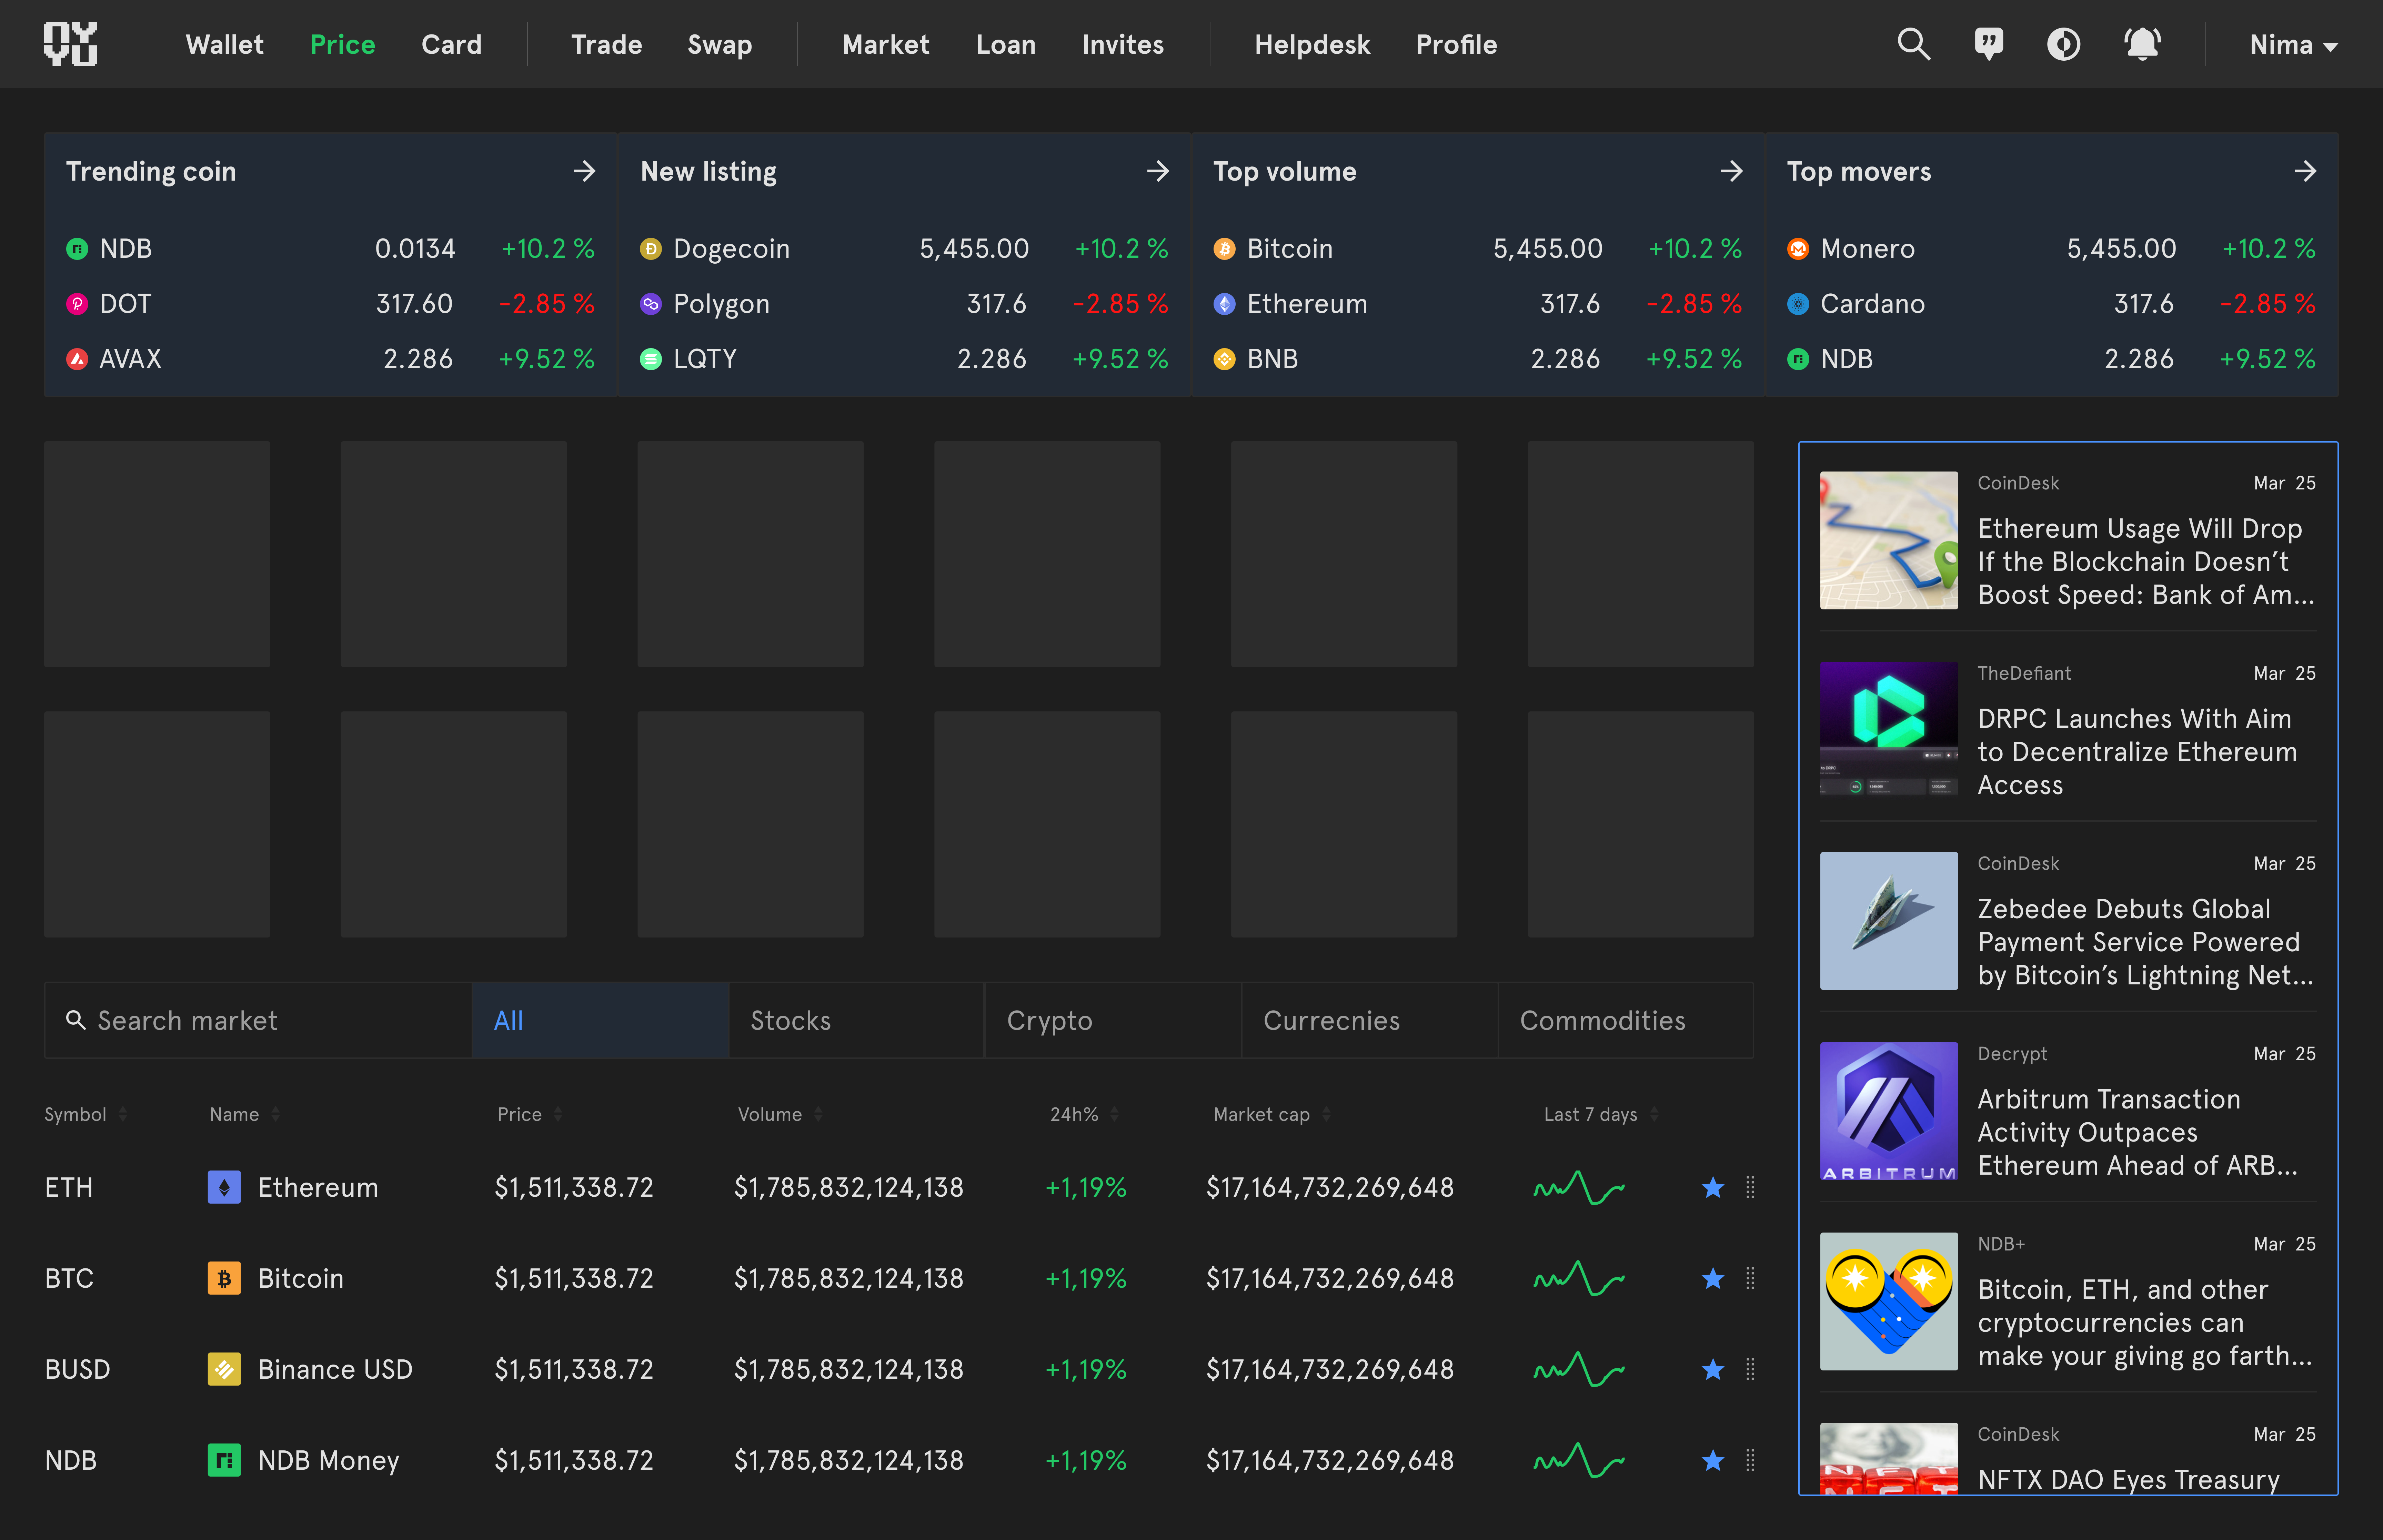
The NYYU Price section provides real-time data and insights into various financial assets, including cryptocurrencies, stocks, currencies, and commodities. This section is designed to help users stay informed about market trends, new listings, top volume assets, and top movers.
Key Features
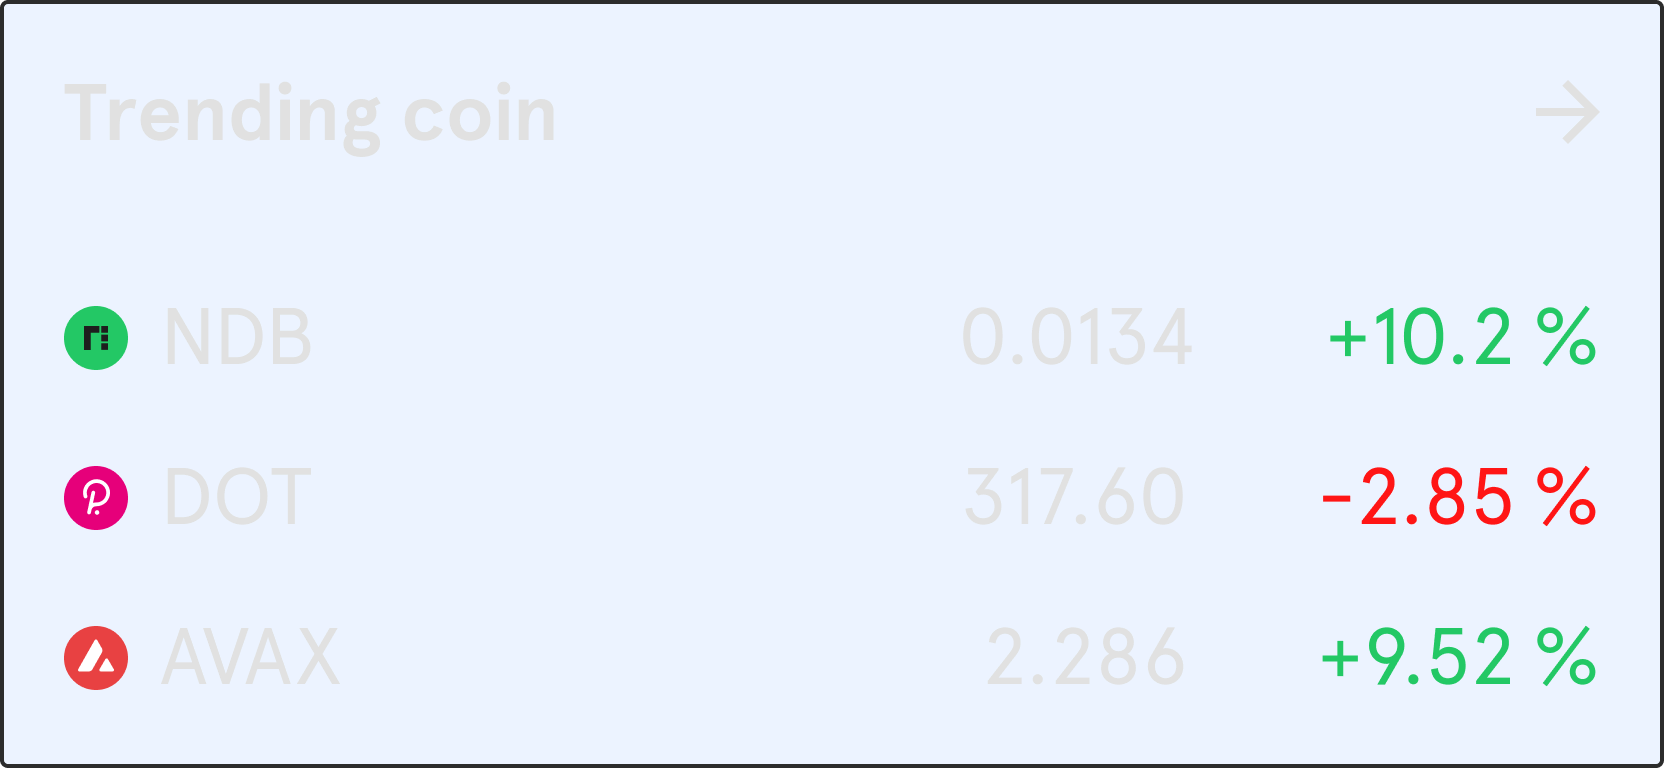
- Trending Coins: Displays the current price and percentage change of trending cryptocurrencies.
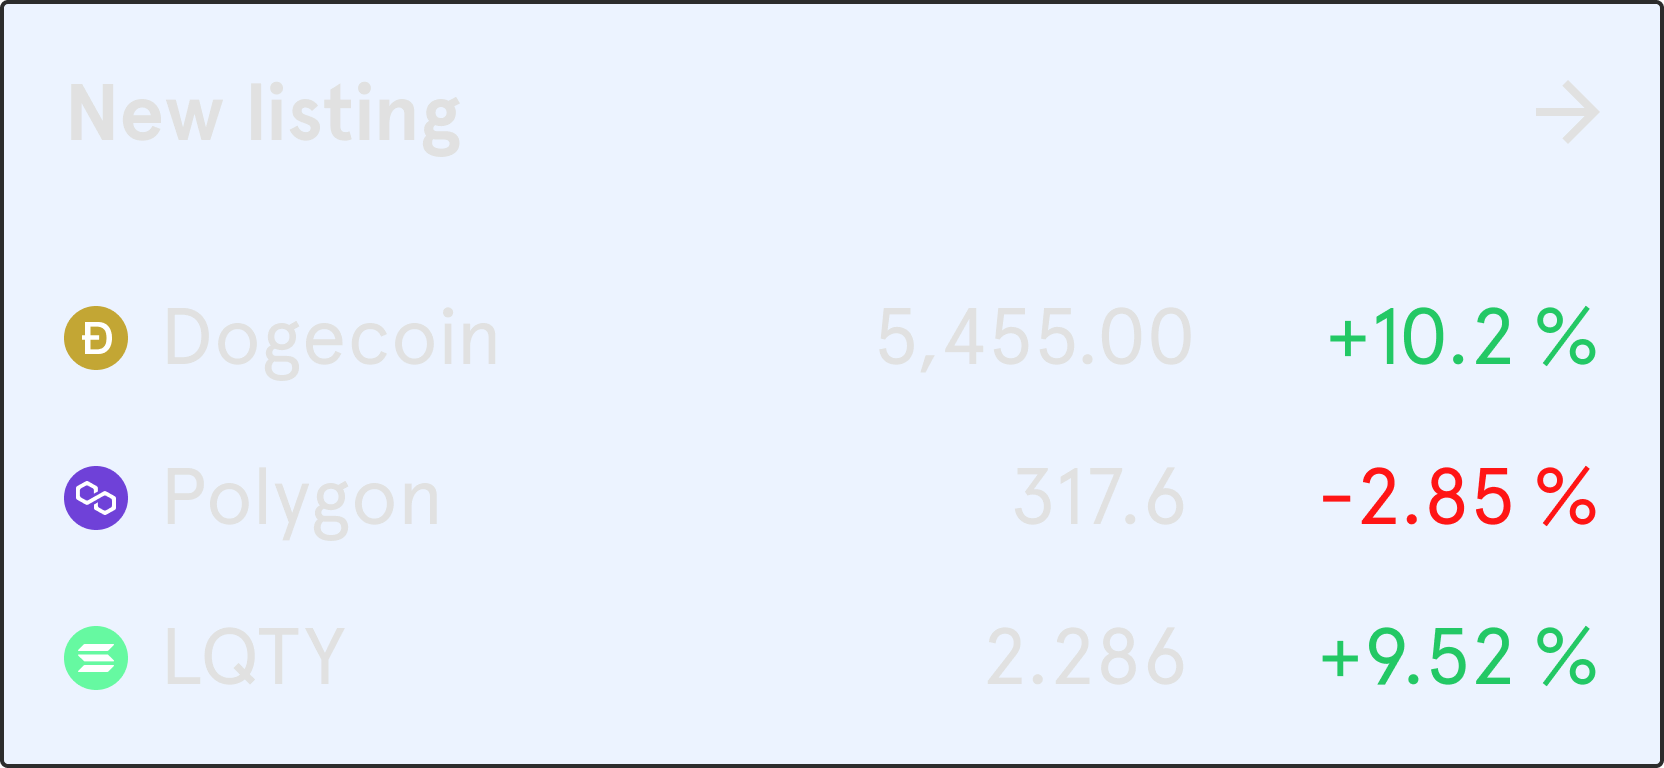
- New Listings: Highlights newly listed assets and their performance.
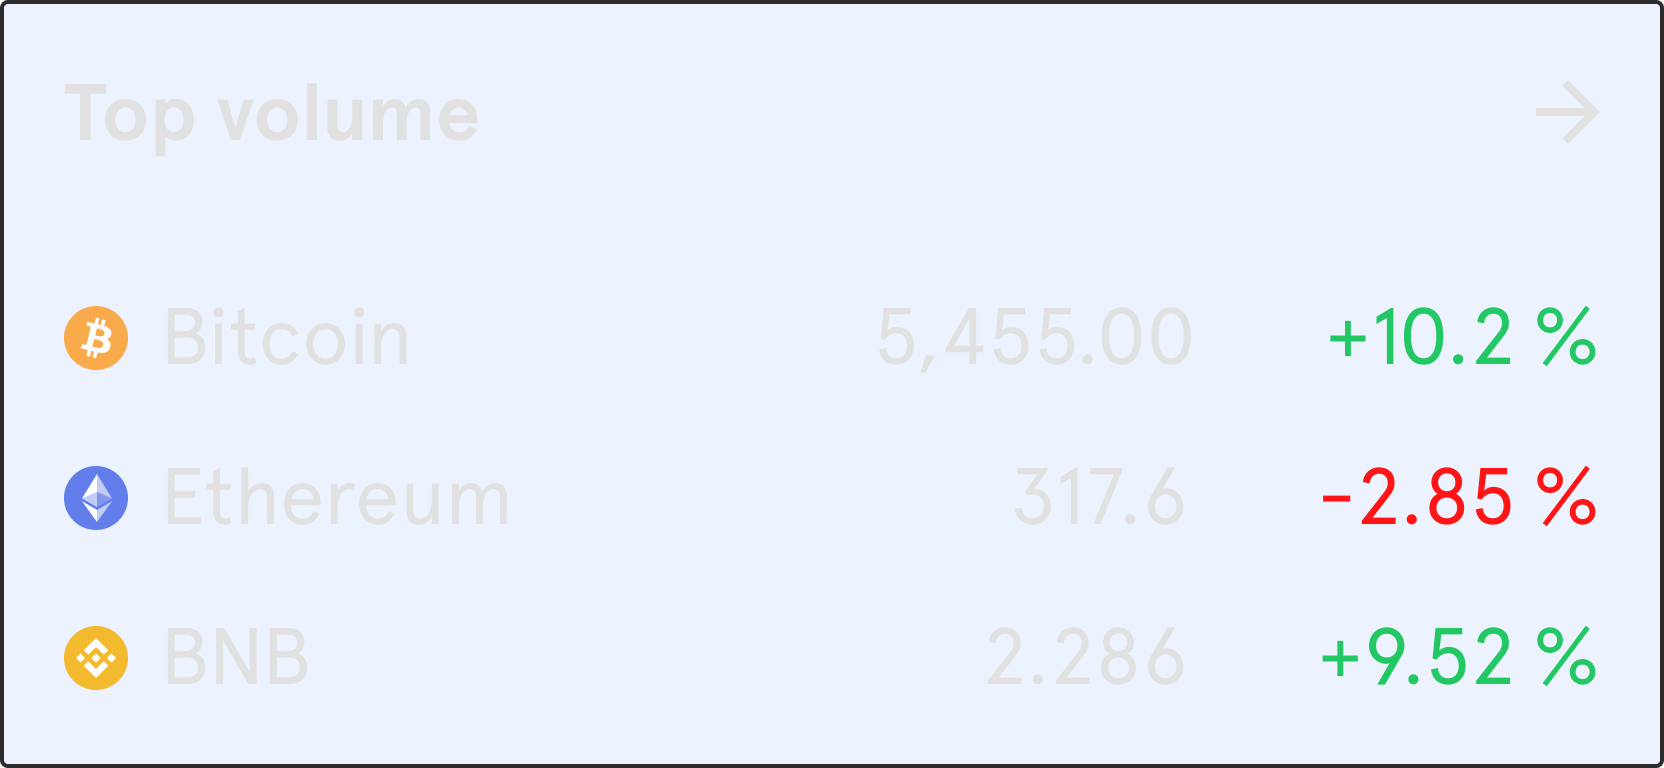
- Top Volume: Shows assets with the highest trading volume.
- Top Movers: Lists assets with the highest price movements, both positive and negative.
- News Feed: Provides the latest news and updates related to financial markets.
Managing Your NYYU Price Dashboard
Viewing Market Trends
At the top of the Price section, you will find key market trends divided into three categories:
-
Trending Coins: Displays the price and percentage change of the most trending cryptocurrencies.
-
New Listings: Highlights the latest assets added to the platform along with their price and percentage change.
-
Top Volume: Shows the assets with the highest trading volume in the market.
-
Top Movers: Lists the assets with the highest price movements, indicating significant market changes.

Exploring Detailed Market Data
Below the market trends section, you will find a comprehensive list of financial assets. Use the search bar and filters to find specific assets or categories, such as stocks, crypto, currencies, or commodities.
- Search Market: Quickly find specific assets using the search bar.
- Filter Options: Use the filter options to display all assets, stocks, crypto, currencies, or commodities.
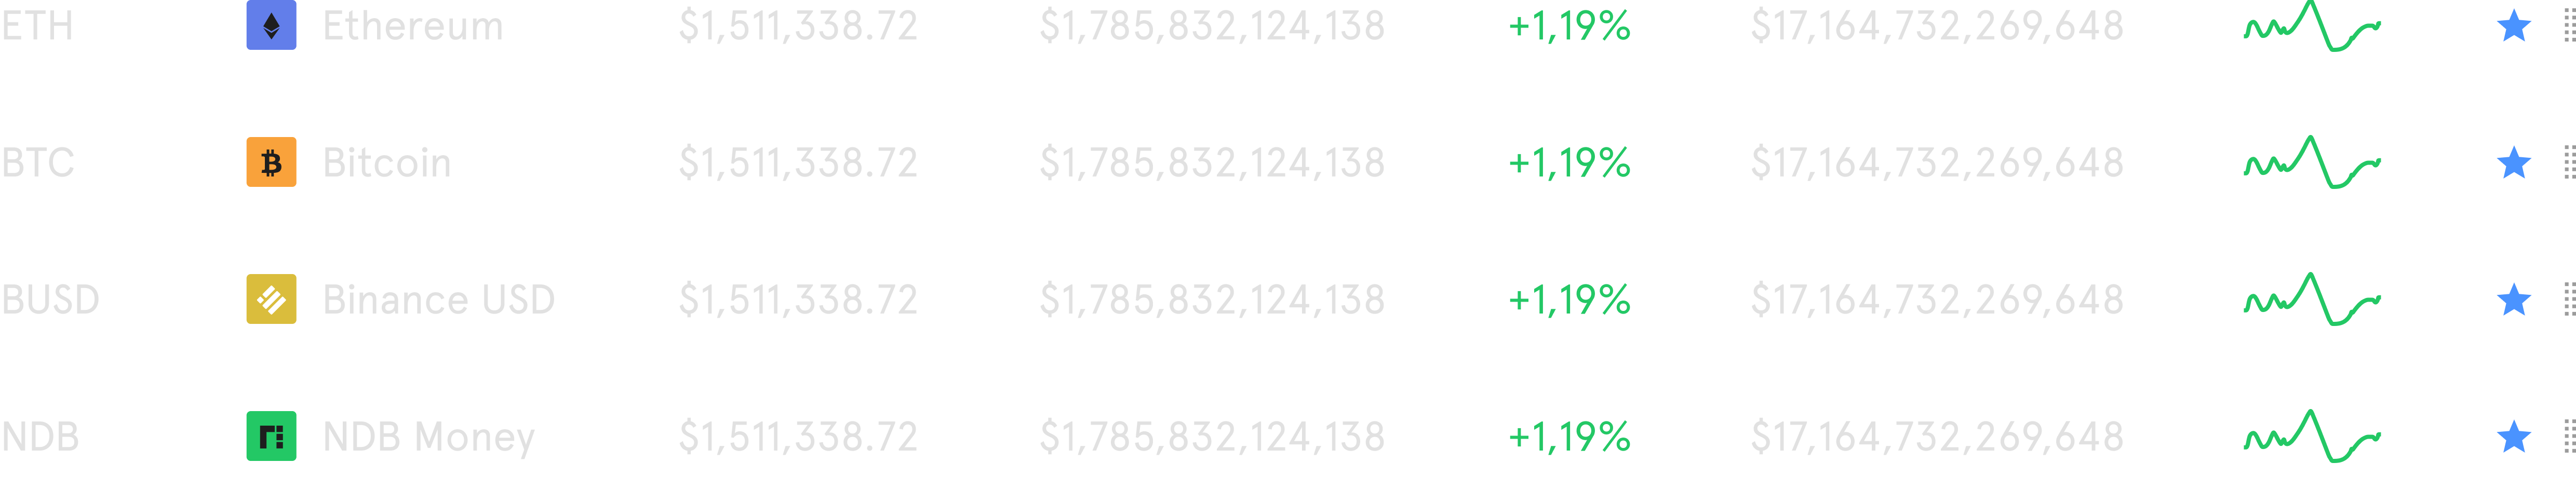
Viewing Asset Details
Each asset listed provides detailed information, including:
- Symbol and Name: The symbol and name of the asset.
- Price: Current price of the asset.
- Volume: The trading volume of the asset.
- 24h Change: The percentage change in the asset's price over the last 24 hours.
- Market Cap: The total market capitalization of the asset.
- Last 7 Days: A mini chart showing the price trend of the asset over the last seven days.
Keeping Up with Market News
On the right side of the Price section, there is a news feed that provides the latest updates and articles related to financial markets. This helps users stay informed about significant events and trends that could impact their investments.